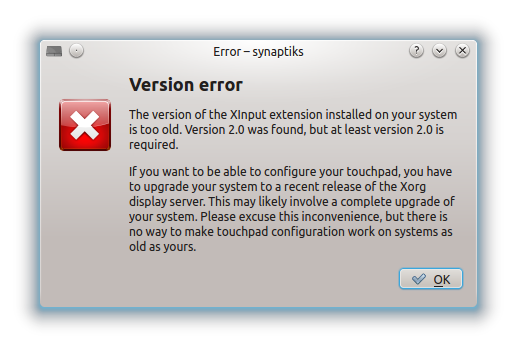
I’m trying to get to the bottom of this bug on Launchpad which completely breaks Synaptic touchpad configuration under KDE:
https://bugs.launchpad.net/ubuntu/+source/synaptiks/+bug/1039261
The tl;dr version is that the Python interpreter is somehow emitting two calls to the Xorg libXi function XIQueryVersion(), the first call sends a client XInput version number of 2.1 and then the second one sends 2.0 (seen using xtrace).
The second call causes a BadValue error, because you’re not meant to send a lower value on any later calls (as can be seen from this Xorg libXi git commit).
This causes the comical error:

The problem is that the Python code only has the second call sending the 2.0 version number, there is no other call in the package that will send anything else, let alone the 2.1 value.
So I want to generate a call trace every time the XIQueryVersion() function is called, but I’m struggling to get it to work.
The killer at the moment is that both ltrace and gdb (when told to trace children) hang when python runs dash to run ldconfig.real and that blocks – so I never get to the point where the function gets called the first time.
With GDB I’m using:
set detach-on-fork off

set follow-fork-mode child

set follow-exec-mode new

catch load /libXi/

break XIQueryVersion
…and this is what happens:
chris@chris-ultralap:~/Code/Ubuntu$ gdb /usr/bin/python
GNU gdb (GDB) 7.5-ubuntu
Copyright (C) 2012 Free Software Foundation, Inc.
License GPLv3+: GNU GPL version 3 or later
This is free software: you are free to change and redistribute it.
There is NO WARRANTY, to the extent permitted by law. Type "show copying"
and "show warranty" for details.
This GDB was configured as "x86_64-linux-gnu".
For bug reporting instructions, please see:
Reading symbols from /usr/bin/python...Reading symbols from /usr/lib/debug/usr/bin/python2.7...done.
done.
(gdb) set detach-on-fork off
(gdb) set follow-fork-mode child
(gdb) set follow-exec-mode new
(gdb) catch load /libXi/
Catchpoint 1 (load)
(gdb) break XIQueryVersion
Function "XIQueryVersion" not defined.
Make breakpoint pending on future shared library load? (y or [n]) y
Breakpoint 2 (XIQueryVersion) pending.
(gdb) run /usr/bin/synaptiks
Starting program: /usr/bin/python /usr/bin/synaptiks
[Thread debugging using libthread_db enabled]
Using host libthread_db library "/lib/x86_64-linux-gnu/libthread_db.so.1".
[New process 3788]
[Thread debugging using libthread_db enabled]
Using host libthread_db library "/lib/x86_64-linux-gnu/libthread_db.so.1".
Thread 0x7ffff6ccc700 (LWP 3788) is executing new program: /bin/dash
[New process 3789]
process 3789 is executing new program: /bin/dash
process 3789 is executing new program: /sbin/ldconfig.real
…and there it hangs, forever. We never even get to the point where the Python interpreter loads libXi.so, let alone calls the function. 🙁
Any ideas?


A ld preload library that aborts when the version passed is 2.0 ?
Bingo! That’s the way to do it (with
ulimit -c unlimitedof course).I patched the libXi sources and built that and I’ve got a backtrace that points to KUniqueApplication() from KDE as being the source of that call (if you’ll pardon the pun).
It’s been fixed by Canonical, which is great.