Fortunately the two Indian islands that have disappeared in the Bay of Bengal do not appear to have been inhabited (though the report doesn’t say about vegetation and animals), but the fact that they appear to have been lost to rising sea levels should give folks everywhere in low lying areas pause for thought.
Category Archives: Science
Richard Dawkins website blocked for being “occult” and “religious”
This is a classic from the New Scientist Feedback section (25th December) where Eliot Attridge let them know that when he wanted to read more about Richard Dawkins:
Unfortunately, the school has installed a net filter called Netsweeper which, Attridge discovered, blocks access to www.richarddawkins.net on the grounds that it is an “occult site”.
To add insult to injury when Eliot tested with Sonicwall that described his site as “religious” – I wonder which wrong label would infuriate Dawkins most ? 🙂
Quenamari Ice Plateau
Dear Lazyweb,
Reading New Scientist for 2nd December 2006 I came across an article about the Quenamari ice plateau in their “This Week 50 Years Ago” section:
The strange feature of this ice formation is that it exists apparently without fresh supplies of moisture in the middle of a region which is entirely free from ice and snow for most of the year despite its altitude of about 18,000 feet above sea level. No glacier feeds this ice; no high mountain peaks are near enough to snatch rain from the clouds to water it. It is unique – so glaciologists say – and its existence remains a mystery.
Problem is that when you search for what’s known about it now there’s very little information, either how it formed or even whether it still exists given the current episode of global warming that’s going on.
Anyone got any clues ?
Another great idea from the Australian Liberal Party
OK, so global warming is going to bleach most of the Great Barrier Reef if business as usual carries on in the world. So the Australian Liberal Party (currently in power) has come up with a really great idea to protect part of it – the Federal Tourism minister wants to cover part of it with a shade cloth!
Federal Tourism Minister Fran Bailey says using “shade cloth” over parts of the Great Barrier Reef off Queensland could protect it from the harmful effects of global warming.
This is based upon the fact that a scientist noticed that shaded areas of the reef currently have more vibrant colours. However, my guess is that this won’t be enough to save the polyps from the rising water temperatures which will be the main issue. Sure, the shade will reduce local temperatures relative to exposed areas, but that won’t stop a general trend in temperature rise from the effects of the surrounding water.
Vegemite and the US FDA
There’s been a fair bit of discussion around the web about the US FDA banning the import of Vegemite (( Alec Muffett – US govt bans Vegemite )) (( Andrew Pollock – Egad. They’ve banned Vegemite! )) (( BoingBoing – US govt bans Vegemite )) ((News.com.au – US bans Vegemite )).
Well I went digging around because this sounded a little too odd and because the only source was a tiny news story that gave no details. Wikipedia’s Vegemite entry mentions the ban but is equivocal about the veracity of the reports and if you check the history and the discussion page there’s quite a debate about whether or not its real.
So I went to the horses mouth – I left a feedback message on the Vegemite website asking about whether this was real or not and (to my suprise) got a rapid response from Kraft Foods, which I’m waiting to see if they’ll give me permission to quote.
The summary is that the news story is pretty much accurate, if a little old, Kraft Foods haven’t been exporting Vegemite to the US for 12 months now because of the US FDA’s regulations on what foods are allowed to have folate fortification.
How Big Was North Korea’s Bomb ?
My good friend Alec wrote on hearing about the DPRK nuclear test:
One presumes that there is a small chance it’ll have been staged with conventionals;
That got me thinking – how large a bomb was it ? We know the USGS detected a mag 4.2 shock so I went hunting around to see if there was an algorithm for converting magnitudes on the Richter Scale into energy, and, hopefully, into kilotons or megatons. It turns out J.C. Lahr wrote up a method for the “Comparison of earthquake energy to nuclear explosion energy” and helpfully included a piece of Fortran code to create a table of comparisons.
A quick “apt-get install gfortran” and a bit of mucking around with the code and I had an approximate answer:
Mag.   Energy      Energy      TNT         TNT         TNT         Hiroshima
       Joules      ft-lbs      tons        megatons   equiv. tons  bombs
4.2   0.126E+12   0.929E+11   0.301E+02   0.301E-04   0.201E+04   0.134E+00
So a magnitude 4.2 earthquake is (roughly) equivalent to a 2 kiloton device, less than one fifth of the size of Hiroshima bomb. This means it’s probably unlikely to have been a conventional device.
So what North Korea tested was fairly small in these days of megaton devices but certainly nothing you’d want to be anywhere near..
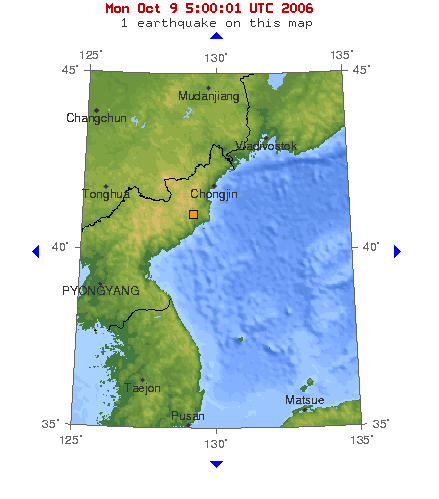
USGS Reports Mag 4.2 Quake in North Korea
Here’s possible confirmation of the nuclear test in North Korea, the USGS has a report of a magnitude 4.2 quake near Chongjin, North Korea. Capture of the map is below.
Update 2014-09-30: Please note that the above links no longer work, thanks to Sharon Thornton (Research Coordinator at The International Union of Geodesy and Geophysics) for pointing that out. Instead here is an alternative URL with information about the quake and also a PDF report on it from the Center for Nonproliferation Studies and the Monterey Institute of International Studies.
MRO Images Opportunity Rover
This is an excellent demonstration of the power of the MRO’s HiRISE camera, it has managed to return a beautiful full colour image of Victoria Crater and capture a view of the Opportunity rover from orbit.
Click on the thumbnail below to see the sub-image of the rover:

Mars Reconnaissance Orbiter HiRISE Camera Returns First Low-Level Image
Yay! After months of waiting NASA’s MRO has reached its science orbit and taken its first snap with its HiRISE camera. NASA has a press release with a link to the gallery page of the image which has a scale of about 1 foot per pixel. They also have an 8MB TIFF “sub-image” available for download from the MRO’s calibration gallery.
But for the very latest you’ve got to check out the HiRISE team blog where they already have the fact that the second image is down, of layered deposits at the Martian North Pole.
Below is the first image!

Update: the page with the full image from which the above sub-image was taken is also available, but be warned, the full size JPEG is 23444 x 23377 pixels and ways in at a hefty 111.8 MBytes!
Research Challenges in Astronomy
I’ve been at the first APAC All Hands Meeting this week, generally hearing what all the other people in the APAC Grid project are up to and meeting folks from around the country that I only otherwise get to see via Access Grid.
Today was the turn of some of the science areas to tell us what they are up to and what they see their big challenges being, and the most scariest (from an HPC perspective) was the session on Astronomy and Astrophysics by Peter Quinn (formerly of the ESO and now a Premier’s Fellow at UWA).
The most intimidating points I picked up from his presentation were:
- Data explosion – doubling time
T2was < 12 months, with new big survey projects such as VST and VISTA that will become T2 < 6 months! - Disk technology T2 is 10 years at present (according to Peter), and slowing.
- The Large Synoptic Survey Telescope is reckoned to capable of producing 7 PetaBytes per annum of data.
- The ESO’s data archive is currently (2006) 100TB in 10 racks and using 70kW of power. By 2012 it is forecast to be 10PB in 100 racks and consuming 1MW of electricity.
- A recent Epoch of Reionisation simulation of 5,0003 particles on a 1,000 CPU Opteron cluster used 2 months of CPU time and 10TB physical RAM (about 10GB per core) and produced about 100TB of output data.
- Catalogue sizes are exploding, in 2000 there were about 100,000 galaxies in a catalogue, by 2010 that will be 1 billion.
- Algorithms are not scaling with these data sizes – an algorithm that took 1 second in 2000 will take 3 years in 2010!
But these problems pale into insignificance when you consider the massive Square Kilometre Array (SKA) radio telescope, it is forecast to produce 100 ExaBytes (that’s one hundred million TeraBytes) of data annually!
This raises a number of very fundamental issues:
- The terabit speed network technologies needed to get the data off the detectors does not exist (yet).
- There is no storage technology to cope with the volumes of data.
- This means they will need to process the data on the fly in a highly parallel manner.
- This is a radio telescope, so there is no time when it cannot take data, unlike an optical ‘scope. This means you cannot somehow buffer the night time data and then process it during the day.
- If the ESO estimate of 1 megawatt of power for 7 PB is correct, and assuming that power per PB stays roughly and they do store all 100 EB of data, then the storage of one years data will need about 14GW of generating capacity.
Fortunately construction of the SKA isn’t due to start until 2013, so we’ve got a bit of time to solve all these.. 🙂